Vector のスタイル †
- new ol.layer.Vector の style にスタイルを指定する
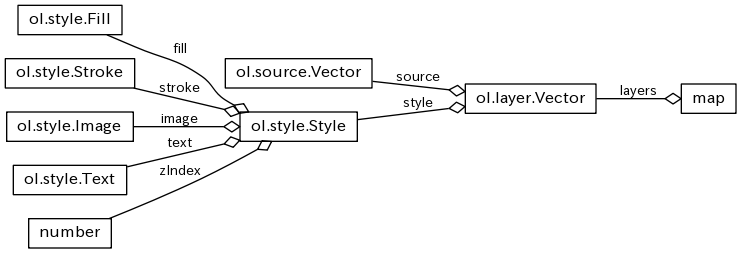
- Styleには次を指定できる http://openlayers.org/en/v3.8.1/apidoc/ol.style.Style.html
| クラス | 機能 | オプション |
| ol.style.Fill | 塗りつぶし | color |
| ol.style.Stroke | 枠線 | color, lineCap, lineJoin, lineDash, miterLimit , width |
| ol.style.Image | Point に表示する図形の抽象クラス |
| ol.style.Circle (Image) | Pointに描画する円 | fill, radius, snapToPixel?, stroke |
| ol.style.Icon (Image) | Pointに描画するアイコン画像 | img, opacity, scale, ... |
| ol.style.RegularShape (Image) | Pointに描画する正多角形 | fill, points, radius, stroke, ... |
| ol.style.Text | テキスト表示 | font, offsetX, offsetY, scale, rotation, text, textAlign, textBaseline, fill, stroke |
最初の Vector Style †
- colorの設定方法
- 配列
- [255,255,255,1] ⇔ [$r,$g,$b,$a]
- CSSの色指定文字列
<!doctype html>
<html lang="en">
<head>
	<link rel="stylesheet" href="css/ol.css" type="text/css"/>
	<link rel="stylesheet" href="css/sample.css" type="text/css"/>
	<style>
	body {
		padding : 0;
		margin : 0;
	}
	</style>
	<title>OpenLayers 3 example 13 Vector Style</title>
</head>
<body>
    <div id="map" class="map"></div>

<script src="js/jquery-2.1.4.min.js"></script>
<script src="js/ol-debug.js"></script>
<script type="text/javascript">

var vectorSource = new ol.source.Vector({
	format: new ol.format.GeoJSON(),
	url: 'js/countries.geojson'
});

var countryStyle = new ol.style.Style({
	stroke: new ol.style.Stroke({
		color: 'darkgreen',
		width: 2
	}),
	fill : new ol.style.Fill({
		color: 'rgba(194, 255, 194, 1)'
	}),
});

var vectorLayer = new ol.layer.Vector({
	source: vectorSource,
	style: countryStyle
});

var map = new ol.Map({
	target: 'map',
	layers: [vectorLayer],
	view: new ol.View({
	  center: ol.proj.transform([135, 35], 'EPSG:4326', 'EPSG:3857'),
	  zoom: 3
	})
});
</script>
</body>
</html>
Style を 複数回適用する †
- Style は複数回適用することができる
- 下の例は、zIndex:1 に太い枠線で世界地図を書いた後に、zIndex:2 に細い枠線で世界地図を書くことで、海岸線に影をつけたような効果をだしている
<!doctype html>
<html lang="en">
<head>
	<link rel="stylesheet" href="css/ol.css" type="text/css"/>
	<link rel="stylesheet" href="css/sample.css" type="text/css"/>
	<style>
	body {
		padding : 0;
		margin : 0;
	}
	</style>
	<title>OpenLayers 3 example 14 Vector Style 2</title>
</head>
<body>
    <div id="map" class="map"></div>

<script src="js/jquery-2.1.4.min.js"></script>
<script src="js/ol-debug.js"></script>
<script type="text/javascript">

var vectorSource = new ol.source.Vector({
	format: new ol.format.GeoJSON(),
	url: 'js/countries.geojson'
});

var countryStyle = new ol.style.Style({
	stroke: new ol.style.Stroke({
		color: 'rgba(0, 128, 0, 1.0)',
		width: 2
	}),
	fill : new ol.style.Fill({
		color: 'rgba(194, 255, 194, 1)'
	}),
	zIndex: 2
});

var shadowStyle = new ol.style.Style({
	stroke: new ol.style.Stroke({
		color: 'rgba(0, 64, 0, 0.2)',
		width: 8
	}),
	fill : null,
	zIndex: 1
});

var vectorLayer = new ol.layer.Vector({
	source: vectorSource,
	style: [countryStyle, shadowStyle]
});

var map = new ol.Map({
	target: 'map',
	layers: [vectorLayer],
	view: new ol.View({
	  center: ol.proj.transform([135, 35], 'EPSG:4326', 'EPSG:3857'),
	  zoom: 3
	})
});
</script>
</body>
</html>
Style function で feature ごとにスタイルを変える †
- ol.layer.Vector の style フィールドに ol.style.Style を直接設定する他に [ol.style.Style] を返す function(feature, resolution){} を設定することができる
- 引数の feature で、GeoJSON の付帯情報を取得することができるので、それによって Style を変えることができる
<!doctype html>
<html lang="en">
<head>
	<link rel="stylesheet" href="css/ol.css" type="text/css"/>
	<link rel="stylesheet" href="css/sample.css" type="text/css"/>
	<style>
	body {
		padding : 0;
		margin : 0;
	}
	</style>
	<title>OpenLayers 3 example 15 Style Function</title>
</head>
<body>
    <div id="map" class="map"></div>
    <span style="background-color:gold">1. Developed region: G7</span>
    <span style="background-color:orange">2. Developed region: nonG7</span>
    <span style="background-color:silver">3. Emerging region: BRIC</span>
    <span style="background-color:lightblue">4. Emerging region: MIKT</span>
    <span style="background-color:dodgerblue; color:white">5. Emerging region: G20</span>
    <span style="background-color:blue; color:white">6. Developing region</span>
    <span style="background-color:darkblue; color:white">7. Least developed region</span>

<script src="js/jquery-2.1.4.min.js"></script>
<script src="js/ol-debug.js"></script>
<script type="text/javascript">

var vectorSource = new ol.source.Vector({
	format: new ol.format.GeoJSON(),
	url: 'js/countries.geojson'
});

var countryStyles = new Array();

for (color of ['white','gold','orange','silver','lightblue','dodgerblue','blue','darkblue']) {
	var countryStyle = new ol.style.Style({
		stroke: new ol.style.Stroke({
			color: 'black',
			width: 1
		}),
		fill : new ol.style.Fill({
			color: color
		})
	});

	countryStyles.push(countryStyle);
}

var vectorLayer = new ol.layer.Vector({
	source: vectorSource,
	style: function(feature, resolution) {
		try {
			var devLevel = feature.get('economy').substring(0,1);
			return [countryStyles[parseInt(devLevel, 10)]];
		} catch(e) {
			return [countryStyles[0]];
		}
	}
});

var map = new ol.Map({
	target: 'map',
	layers: [vectorLayer],
	view: new ol.View({
	  center: ol.proj.transform([135, 35], 'EPSG:4326', 'EPSG:3857'),
	  zoom: 3
	})
});
</script>
</body>
</html>
アイコンを表示する †
- (50px x 50px) x 10枚 の画像からアイコン一枚分を切り取って ol.image.Image に割り付ける
- offset から size 分だけ切り取る
- Image の他に、Circle や RegularShape? も同様に指定することができる
<!doctype html>
<html lang="en">
<head>
	<link rel="stylesheet" href="css/ol.css" type="text/css"/>
	<link rel="stylesheet" href="css/sample.css" type="text/css"/>
	<style>
	body {
		padding : 0;
		margin : 0;
	}
	</style>
	<title>OpenLayers 3 example 16 Earthquake with Icon</title>
</head>
<body>
    <div id="map" class="map"></div>

<script src="js/ol-debug.js"></script>
<script type="text/javascript">

var rasterLayer = new ol.layer.Tile({
	source: new ol.source.Stamen({layer: 'watercolor'})
});

var vectorSource = new ol.source.Vector({
	format: new ol.format.GeoJSON(),
	url: 'js/earthquake.geojson'
});

var magStyles = new Array();

for (var mag = 0; mag < 10; mag++) {
	var magStyle = new ol.style.Style({
		image : new ol.style.Icon({
			size : [50,50],
			offset : [mag * 50, 0],
			scale : 0.25,
			opacity : 0.8,
			src : 'img/number.png'
		}),
		zIndex : mag
	});

	magStyles.push(magStyle);
}

var vectorLayer = new ol.layer.Vector({
	source: vectorSource,
	style: function(feature, resolution) {
		try {
			var mag = parseFloat(feature.get('mag'));
			return [magStyles[Math.floor(mag)]];
		} catch(e) {
			return [magStyles[0]];
		}
	}
});

var map = new ol.Map({
	target: 'map',
	layers: [rasterLayer, vectorLayer],
	view: new ol.View({
	  center: ol.proj.transform([135, 35], 'EPSG:4326', 'EPSG:3857'),
	  zoom: 3
	})
});
</script>
</body>
</html>
テキストを表示する / Resolution †
<!doctype html>
<html lang="en">
<head>
	<link rel="stylesheet" href="css/ol.css" type="text/css"/>
	<link rel="stylesheet" href="css/sample.css" type="text/css"/>
	<style>
	body {
		padding : 0;
		margin : 0;
	}
	</style>
	<title>OpenLayers 3 example 17 Text</title>
</head>
<body>
    <div id="map" class="map"></div>

<script src="js/ol-debug.js"></script>
<script type="text/javascript">

var rasterLayer = new ol.layer.Tile({
	source: new ol.source.Stamen({layer: 'watercolor'})
});

var circleStyle = new ol.style.Style({
	image : new ol.style.Circle({
		radius : 2,
		fill : new ol.style.Fill({
			color: 'yellow'
		}),
		stroke : new ol.style.Stroke({
			color: 'black'
		})
	}),
	zIndex : 1
});

var vectorSource = new ol.source.Vector({
	format: new ol.format.GeoJSON(),
	url: 'js/cities.geojson'
});

var vectorLayer = new ol.layer.Vector({
	source: vectorSource,
	style: function(feature, resolution) {
		var displayRank = 19000/resolution;

		if (feature.get('SCALERANK') > displayRank) {
			return null;
		}

		var labelStyle = new ol.style.Style({
			text : new ol.style.Text({
				font : '12px Monospace',
				text : feature.get('NAME'),
				fill : new ol.style.Fill({
					color: 'white'
				}),
				stroke : new ol.style.Stroke({
					color: 'black'
				}),
				textAlign: 'left',
				textBaseline: 'top'
			}),
			zIndex : 2
		});
		return [circleStyle, labelStyle];
	}
});

var map = new ol.Map({
	target: 'map',
	layers: [rasterLayer, vectorLayer],
	view: new ol.View({
	  center: ol.proj.transform([135, 35], 'EPSG:4326', 'EPSG:3857'),
	  zoom: 3
	})
});
</script>
</body>
</html>
一つの Feature だけスタイルを変える †
<!doctype html>
<html lang="en">
<head>
<link rel="stylesheet" href="css/ol.css" type="text/css"/>
<link rel="stylesheet" href="css/sample.css" type="text/css"/>
<style>
body {
padding : 0;
margin : 0;
}
</style>
<title>OpenLayers 3 example 19 Flag</title>
</head>
<body>
<div id="map" class="map"></div>
<script src="js/ol-debug.js"></script>
<script type="text/javascript">
var rasterLayer = new ol.layer.Tile({
source: new ol.source.Stamen({layer: 'watercolor'})
});
var vectorSource = new ol.source.Vector({
format: new ol.format.GeoJSON(),
url: 'js/countries.geojson'
});
var normalStyle = new ol.style.Style({
stroke: new ol.style.Stroke({
color: 'gray',
width: 1
}),
fill : new ol.style.Fill({
color: 'rgba(0, 0, 0, 0)'
})
});
var highlightStyle = new ol.style.Style({
stroke: new ol.style.Stroke({
color: 'rgba(255,64,64,0.6)',
width: 2
}),
fill : new ol.style.Fill({
color: 'rgba(255,255,255,0.2)',
})
});
var vectorLayer = new ol.layer.Vector({
source: vectorSource,
style: normalStyle
});
var map = new ol.Map({
target: 'map',
layers: [rasterLayer,vectorLayer],
view: new ol.View({
center: ol.proj.transform([39.816667, 21.416667], 'EPSG:4326', 'EPSG:3857'),
zoom: 3
})
});
// a temporally layer to display small polygon and text.
// (ol.FeatureOverlay was integrated to ol.layer.Vector at OL3 3.7.0.
// cf. https://github.com/openlayers/ol3/releases/tag/v3.7.0)
var featureOverlay = new ol.layer.Vector({
  source: new ol.source.Vector(),
  map: map,
  style: [highlightStyle]
});
map.on('pointermove', function(browserEvent) {
var coordinate = browserEvent.coordinate;
var pixel = browserEvent.pixel;
// delete the former highlighted feature from the featureOverlay.
// if mouse is pointing sea, there will be no highlighted feature because map.forEach do nothing.
var featureSource = featureOverlay.getSource();
featureSource.clear();
map.forEachFeatureAtPixel(pixel, function(feature, layer) {
if (layer != vectorLayer) {
return;
}
featureSource.clear();
// add current a pointed feature to the featureOverlay
featureSource.addFeature(feature);
});
});
</script>
</body>
</html>
全部盛り †
- 前節 18_Highlight1Feature.html を改修
- 変更点1
- pointermove イベント処理で、マウスポインタが指し示す国の Feature (Polygon, MultiPolygon?) を featureOverlay に追加する他に、国名を表示する位置の Point も featureOverlay に追加するようにした
- 国名を表示する位置の計算が結構大変
- 国の形が Polygon (飛び地がない国) の場合には、簡単。polygon.getInteriorPoint?() で中心 Point が求められるので、そこを国名の表示位置とする。
- 国の形が MultiPolygon? (飛び地がある国) の場合には、まず MultiPolygon?.getInterPoints?() で、各 Polygon の中心から成る MultiPoint? を計算する。
そして、MultiPoint? に格納されている Point のうち、マウスポインタに一番近い Point を国名の表示位置とする。
- 有るかどうかわからないけど Polygon, MultiPolygon? 以外の形の国があったら、マウスポインタから一番近い点を国名の表示位置とする。
- 変更点2
- featureOverlay の style を function にした
- 前節 18_Highlight1Feature.html では、固定的に国の Ploygon, Multipolygon の塗りつぶしを指定
- 今回は、変更点1 にあるように、(Ploygon|Multipolygon) と Pointer が指定される
- (Ploygon|Multipolygon) が引数に指定された場合には、前節同様に国の領域を使塗りつぶす style を返す
- Point が引数に指定された場合は、国名の表示位置が指定されたので、指定された Point に text (国名) と image (国旗) を表示する style を作成する
- 国名には world.geojson に格納されている name を使う
- 国旗の画像ファイル名は world.geojson に格納されている ISO 略号を使う
- 国旗の画像ファイルは http://365icon.com/icon-styles/ethnic/classic2/ からいただいた。商用利用も可らしい
<!doctype html>
<html lang="en">
<head>
	<link rel="stylesheet" href="css/ol.css" type="text/css"/>
	<link rel="stylesheet" href="css/sample.css" type="text/css"/>
	<style>
	body {
		padding : 0;
		margin : 0;
	}
	</style>
	<title>OpenLayers 3 example 19 Flags</title>
</head>
<body>
    <div id="map" class="map"></div>

<script src="js/ol-debug.js"></script>
<script type="text/javascript">

var rasterLayer = new ol.layer.Tile({
	source: new ol.source.Stamen({layer: 'watercolor'})
});

var vectorSource = new ol.source.Vector({
	format: new ol.format.GeoJSON(),
	url: 'js/countries.geojson'
});

var normalStyle = new ol.style.Style({
	stroke: new ol.style.Stroke({
		color: 'gray',
		width: 1
	}),
	fill : new ol.style.Fill({
		color: 'rgba(0, 0, 0, 0)'
	})
});

var vectorLayer = new ol.layer.Vector({
	source: vectorSource,
	style: normalStyle
});

var map = new ol.Map({
	target: 'map',
	layers: [rasterLayer,vectorLayer],
	view: new ol.View({
	  center: ol.proj.transform([39.816667, 21.416667], 'EPSG:4326', 'EPSG:3857'),
	  zoom: 3
	})
});

var highlightStyle = new ol.style.Style({
	stroke: new ol.style.Stroke({
		color: 'rgba(255,64,64,0.6)',
		width: 2
	}),
	fill : new ol.style.Fill({
		color: 'rgba(255,255,255,0.2)',
	}),
	zIndex : 1
});

function highlightFunc(feature, resolution) {
	var geometry = feature.getGeometry();
	if (geometry.getType() == 'Point') {
		var countryNameStyle = new ol.style.Style({
			text : new ol.style.Text({
				font : '20px Monospace',
				text : feature.get('name'),
				fill : new ol.style.Fill({
					color: 'white'
				}),
				stroke : new ol.style.Stroke({
					color: 'black'
				}),
				textAlign: 'left',
				textBaseline: 'top',
				offsetY: -10,
				offsetX: 16
			}),
			image : new ol.style.Icon({
				src: 'img/flags/flags_iso/32/' + feature.get('iso') + '.png'
			}),
			zIndex : 2
		});
		return [countryNameStyle];
	} else {
		return [highlightStyle];
	}
}

// a temporally layer to display small polygon and text.
// (ol.FeatureOverlay was integrated to ol.layer.Vector at OL3 3.7.0.
// cf. https://github.com/openlayers/ol3/releases/tag/v3.7.0)
var featureOverlay = new ol.layer.Vector({
  source: new ol.source.Vector(),
  map: map,
  style: highlightFunc
});

map.on('pointermove', function(browserEvent) {
	var coordinate = browserEvent.coordinate;
	var pixel = browserEvent.pixel;

	// delete the former highlighted feature from the featureOverlay.
    // if mouse is pointing sea, there will be no highlighted feature because map.forEach do nothing.
	var featureSource = featureOverlay.getSource();
	featureSource.clear();
	map.forEachFeatureAtPixel(pixel, function(feature, layer) {
		if (layer != vectorLayer) {
			return;
		}
		featureSource.clear();
		// add current a pointed feature to the featureOverlay for draw country area
		featureSource.addFeature(feature);

		// add center of the feature to the featureOverlay for draw flag and country name text
		var geometry = feature.getGeometry();
		var point;
		switch (geometry.getType()) {
		case 'Polygon' :
			// this country has no detached place.
			point = geometry.getInteriorPoint();
			break;
		case 'MultiPolygon' :
			// this country has some detached place.
			// multiPoint:ol.geom.MultiPoint contains each center point of detached place.
			var multiPoint = geometry.getInteriorPoints();
			// get the closest center point of mouse pointer
			point = new ol.geom.Point(multiPoint.getClosestPoint(coordinate));
			break;
		default :
			// Illegal shape
			point = new ol.geom.Point(geometry.getClosestPoint(coordinate));
			break;
		}

		var textFeature = new ol.Feature({
			geometry: point,
			name: feature.get('name'),
			iso: feature.get('iso_a2').toLowerCase()
		});
		featureSource.addFeature(textFeature);
	});
});
</script>
</body>
</html>
GIS


 number.png